An industrial AI company
that turns industrial floor data
into operational answers
From equipment connectivity, time-series anomaly detection and predictive maintenance, to vision AI, operations screens and manufacturing execution — EdgenomiX designs and builds the EGNOX product family for the industrial floor in-house.
We Start From the Problems Manufacturing Floors Face
More and more equipment gets added, but the data stays scattered; alarms arrive, yet the cause shows up too late. EdgenomiX closes this gap with products.
The Data Is There, but Connecting It Is Hard
Because each machine uses a different communication method and screen, even just collecting the data often takes a long time.
- Legacy equipment and new machines coexist
- Different protocols and wiring environments at every site
- Data structures that remain hard to use even after collection
Anomalies Are Visible, but the Response Is Late
Alarms arrive, but it takes a lot of time to figure out why they happened and where to start looking.
- Identifying the cause matters more than the event itself
- Explanations that floor operators can also understand are needed
- A workflow that reviews history and manuals together is needed
Operational Information Is Fragmented
When equipment status, quality, production status and maintenance history all operate separately, decision-making slows down.
- The gap between floor screens and headquarters screens
- Production, quality and equipment information not connected to each other
- Manual work for reporting is repeated
The EGNOX Product Family
Start with one product matched to your floor's problem, then expand as far as needed. Select a product on the left to review its core features and screen layout.
EGNOX Vision
Product page →A vision AI that connects your existing IP cameras (RTSP) as-is and detects people, safety-gear compliance, fire and more in real time on a PC.
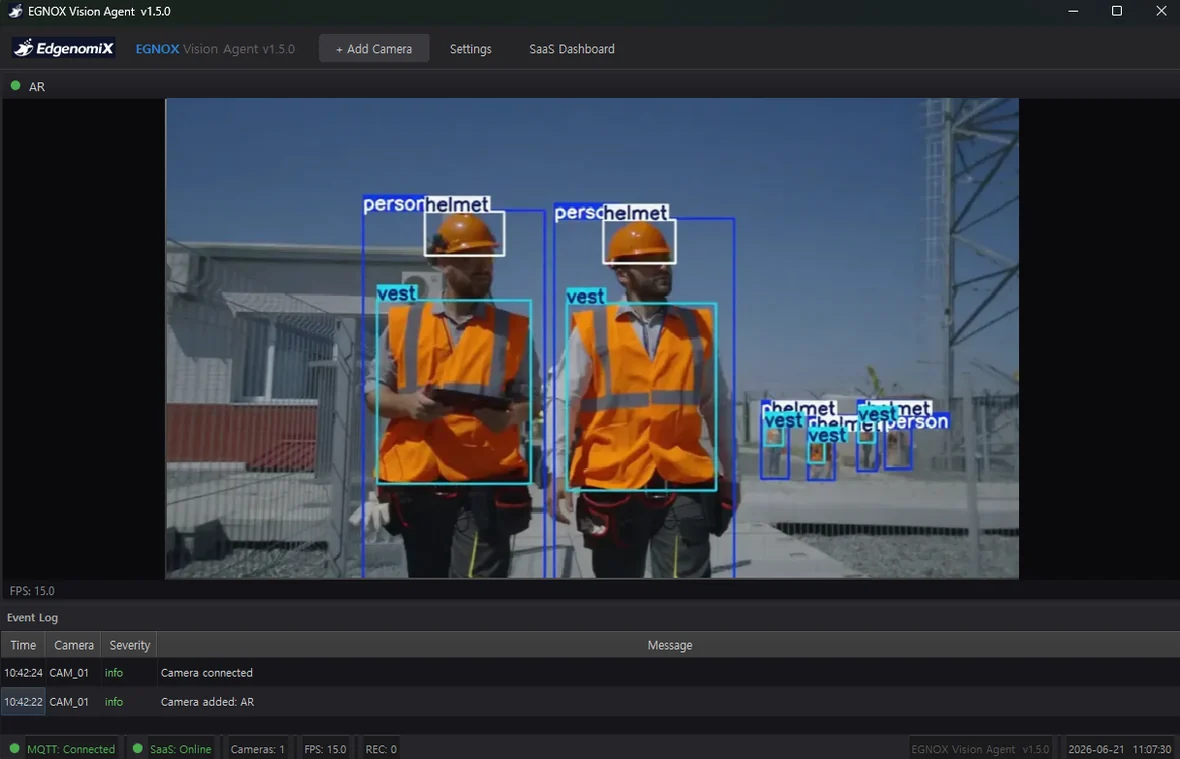
This is the actual operating screen of EGNOX Vision Agent. Displayed items may vary depending on the deployment environment.
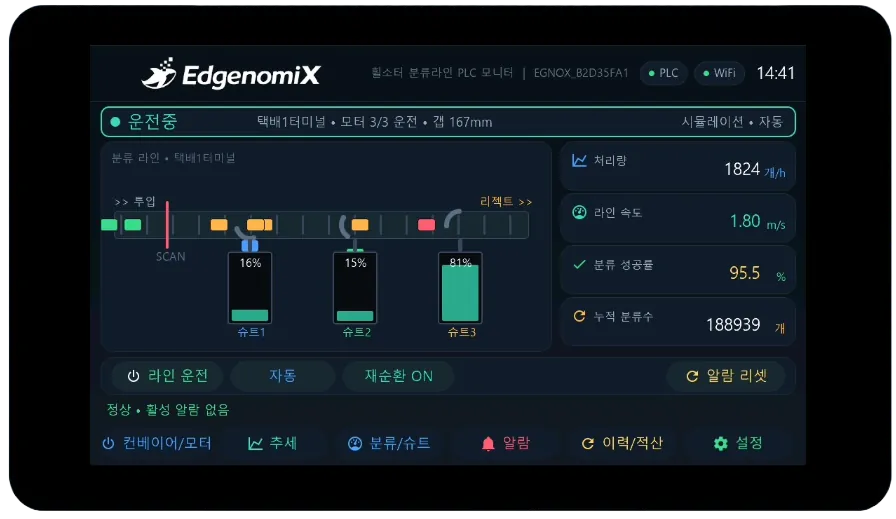
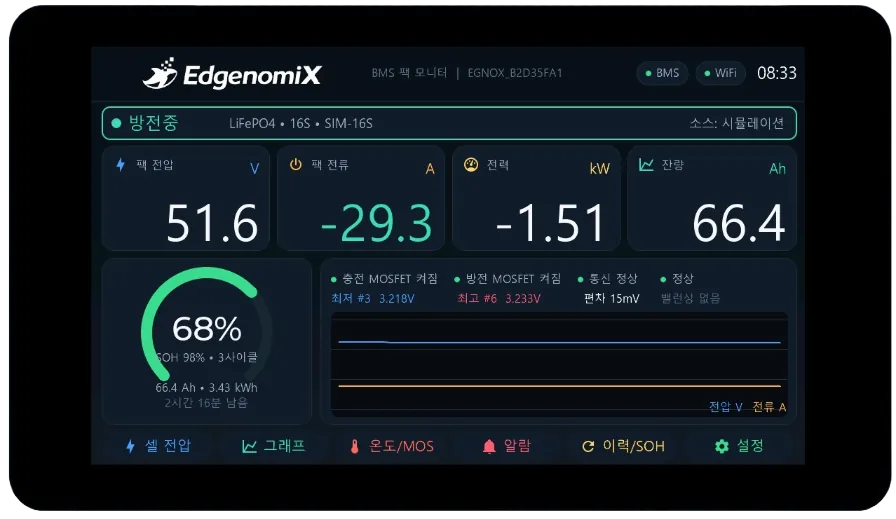
EGNOX Edge HMI
Product page →An edge HMI that runs operation control, real-time monitoring and AI predictive maintenance together on a Raspberry Pi industrial touch monitor.
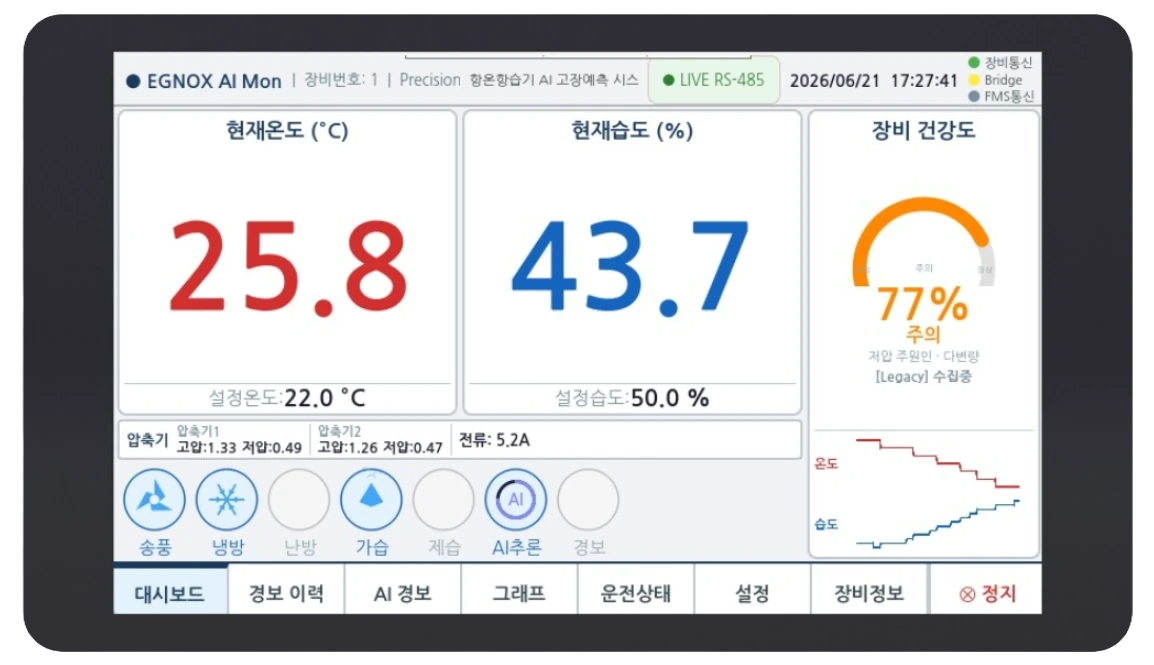
This is the actual operations screen of EGNOX Edge HMI. Displayed items may vary depending on the deployed equipment.
EGNOX Cloud
Product page →An industrial IoT cloud that connects equipment with no-code multi-protocol support and runs everything from widget dashboards and AI predictive maintenance to maintenance — all in one place.
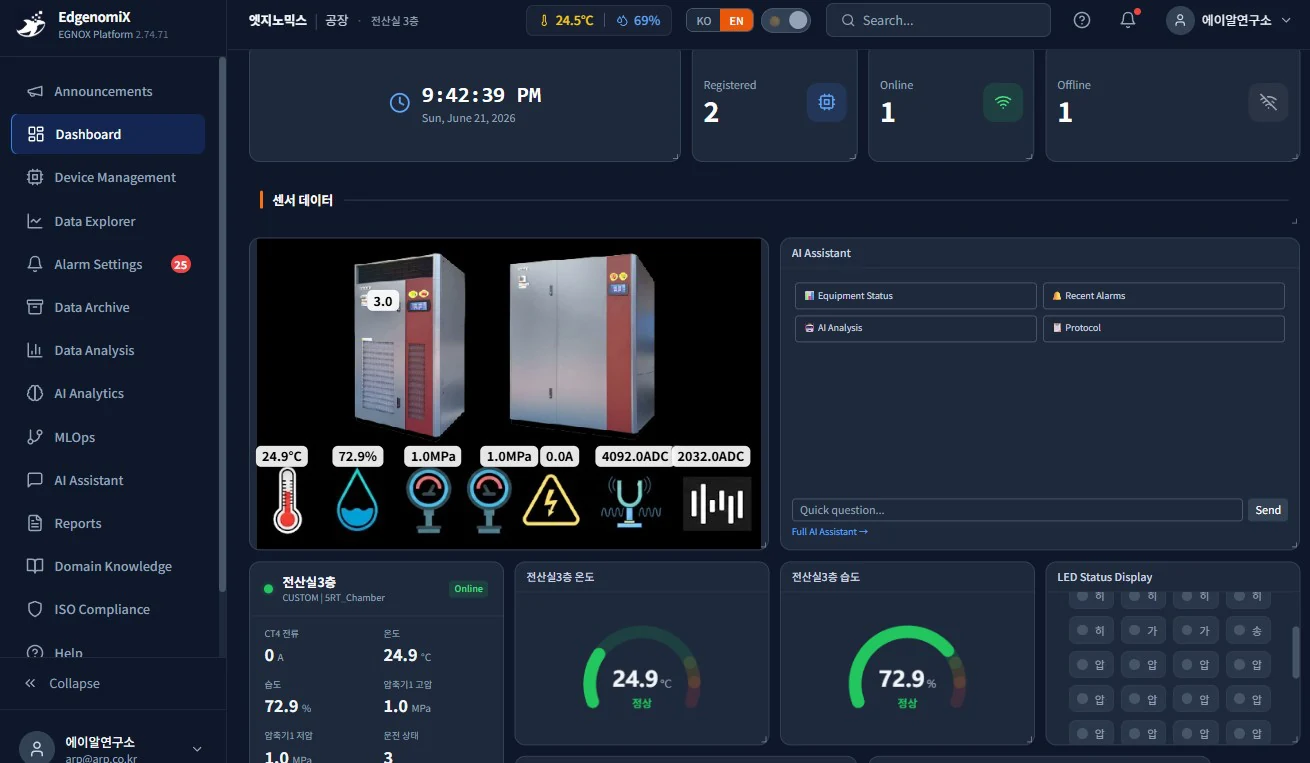
This is the actual screen of EGNOX Cloud. Displayed items may vary depending on the deployment environment.
EGNOX MES
Product page →A manufacturing execution system that runs production execution, quality flow and work-standard search together with AI.
* This is an example screen layout. The actual screen may differ depending on the deployment environment.
EGNOX IoT
Product page →An edge gateway that quickly connects legacy industrial machines and a wide range of field equipment.
* This is an example screen layout. The actual screen may differ depending on the deployment environment.
EGNOX AI Agent
Product page →A self-hosted AI agent that answers based on your company's internal documents and data. We build it on-premises — from standalone, cloud, MES and ERP to a homepage widget.
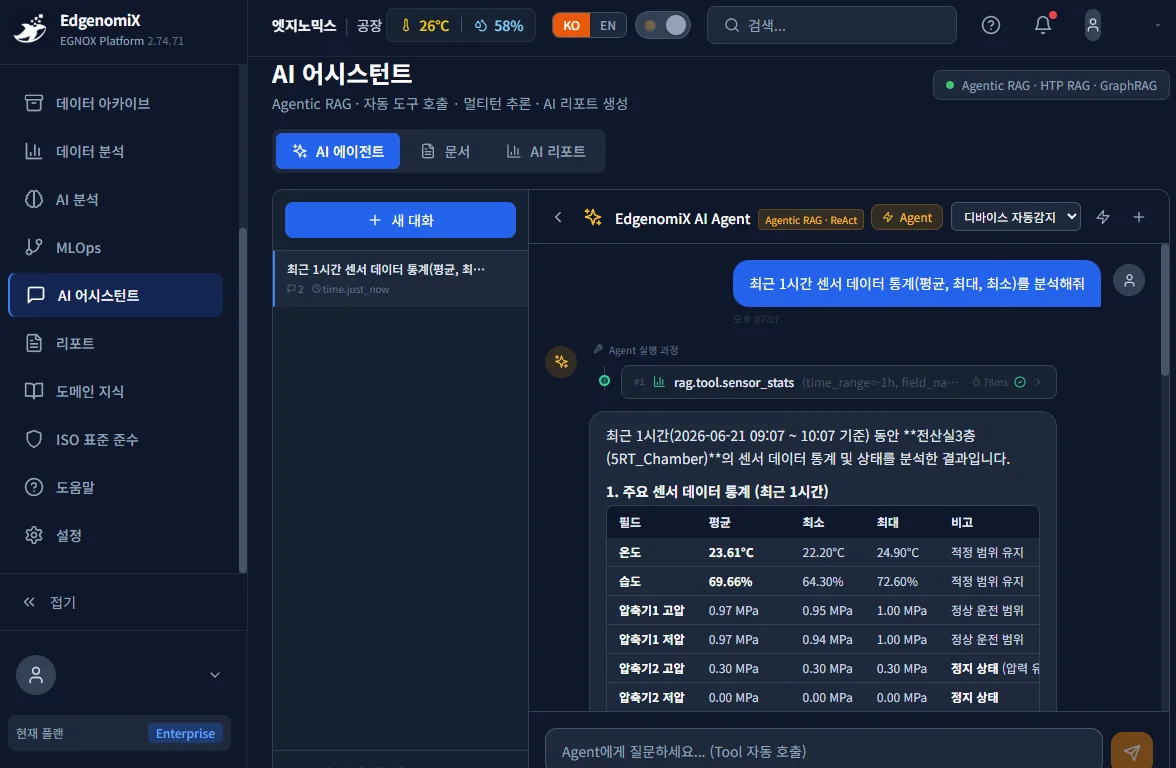
This is the actual screen of EGNOX AI Agent (integrated into EGNOX Platform). Displayed items may vary depending on the deployment environment.
Custom IoT HMI
Product page →From screen design on an ESP32 touch panel to Wi-Fi, BLE, RS-232 and RS-485 communication control — we custom-build HMIs tailored precisely to your equipment at a reasonable cost.
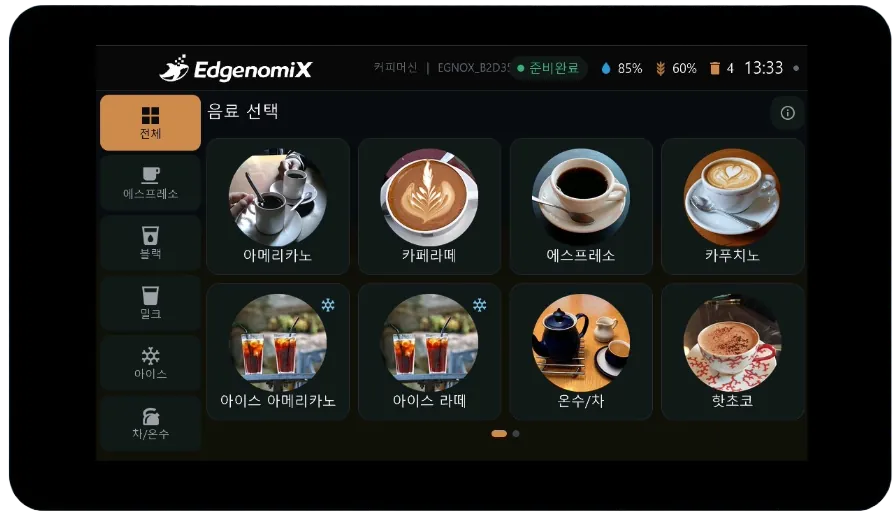
* These are actual HMI screens designed and built in-house by EdgenomiX. The screens may vary depending on the deployment environment.
Custom Embedded Development
Product page →Custom development that designs to your project's goals — from circuitry, PCB and firmware to on-board edge AI.
* This is an example of the development-stage breakdown. The actual scope is agreed per project.
From Equipment to Operations, One Data Flow
Signals from field equipment are collected and analyzed at the edge, operated in the cloud, and connected to manufacturing execution. The EGNOX product family covers each segment of this flow.
International Standards Frameworks as Our Design Baseline
We design time-series anomaly detection and predictive maintenance not as separate features but as a single operating system. The standards below are not a “certification” claim but the baselines we reference when designing products and PoCs.
CM&D Structure and Equipment Criticality
We first define the monitoring layers and priorities, starting by clarifying “what to watch and how often.”
- Data processing, communication and presentation structure based on the ISO 13374 series
- Condition monitoring programme design in the context of ISO 17359
- Adjusting sensor, interval and alarm priorities according to equipment criticality
From Anomaly Detection to RUL
We consider a structure that not only flags whether an anomaly exists but also extends to reviewing deterioration trends and remaining useful life (RUL).
- Reflecting the prognostics / RUL context based on ISO 13381-1
- Separating caution, warning and inspection-recommendation stages
- Recording algorithm outputs separately from operational actions
AI Quality and Explainability
We aim for a structure that records not only model performance figures but also data quality, explanatory grounds and robustness reviews.
- ISO/IEC 23053 AI/ML framework
- ISO/IEC 5259 data quality evaluation framework
- Reflecting the context of ISO/IEC TS 6254 · ISO/IEC TR 24029-1
* The standards referenced on this site indicate design baselines and review items; the scope of per-project certification and conformity declarations requires separate discussion.
Applied on Floors Like These
From safety monitoring to predictive maintenance and production execution — these are the representative scenarios the EGNOX product family handles.
Safety & Vision Monitoring
Using CCTV/IP cameras to quickly identify safety compliance, hazardous situations and process anomalies.
- Related product: Vision
- Field alerts and control-room integration
- Local analysis architecture can be reviewed
Equipment Condition Diagnosis & Predictive Maintenance
We build an operational flow that watches condition changes from sensor data and catches early signs first.
- Related products: Edge HMI · IoT · Cloud
- Choose between a field HMI or cloud control
- Can be linked with maintenance history
Production Execution & Quality Operations
We organize the screens needed for floor execution — from production status and quality events to work-standard search — together with AI.
- Related products: MES · Cloud
- Organizing dashboards and reporting flows
- A phased deployment structure can be designed
Collect → Understand → Operate → Improve:
an approach centered on the real floor workflow
We design it so that it does not stop at equipment connectivity but continues through AI analysis, operations screens, and the reporting and improvement flow.
We first connect field inputs such as sensors, PLCs, cameras and legacy machines.
Through time-series analysis, vision AI and retrieval-based AI, we help explore early signs and their causes.
We carry the response through dashboards, alerts, maintenance, and production-execution screens.
We organize operational metrics and reporting flows to compare before and after deployment and iterate on improvements.
Start Evaluating a Deployment
Product demos, scope of application, deployment schedule — we guide you step by step, tailored to your floor's situation.