Connect without code,
watch ahead with AI,
through to the repair
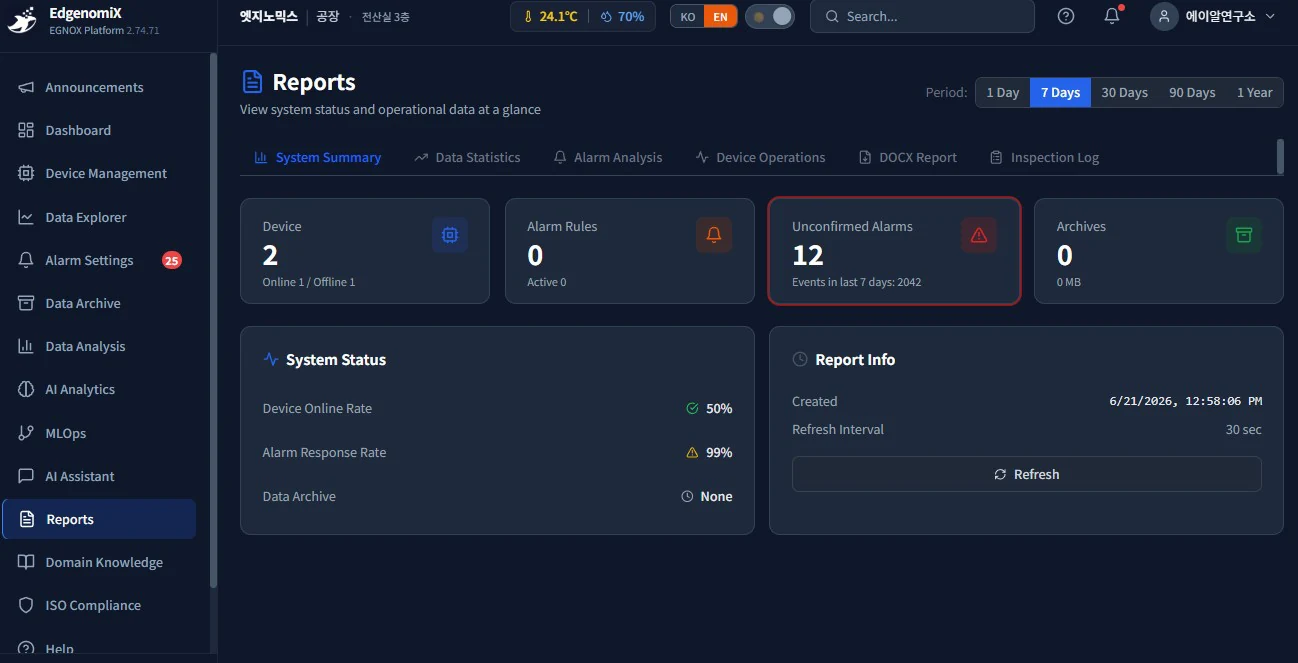
Connect a wide range of equipment with no-code multi-protocol support, monitor it at a glance on widget dashboards, and run everything from AI predictive maintenance to maintenance work orders on a single cloud. Anomaly detection and predictive maintenance are designed in line with the context of ISO/IEC technical documents, and the AI assistant presents causes and recommended actions together with the supporting data.
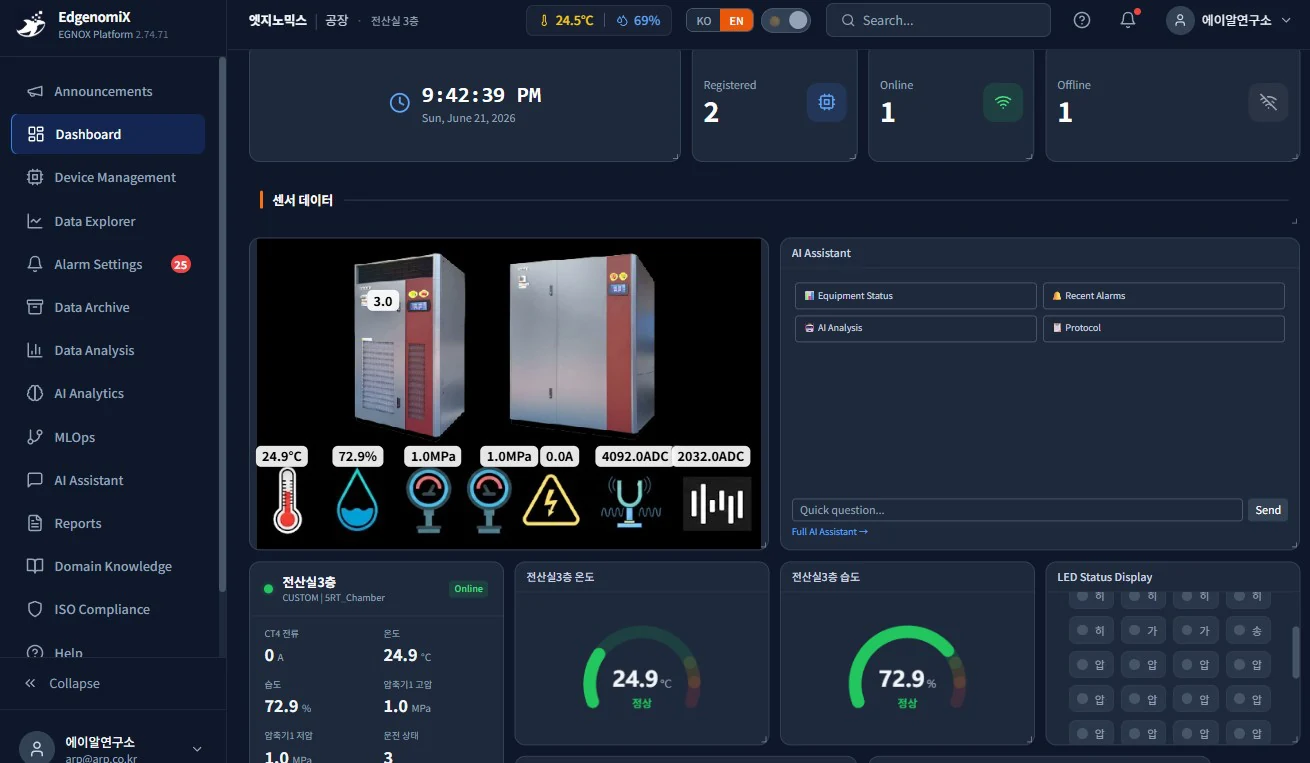
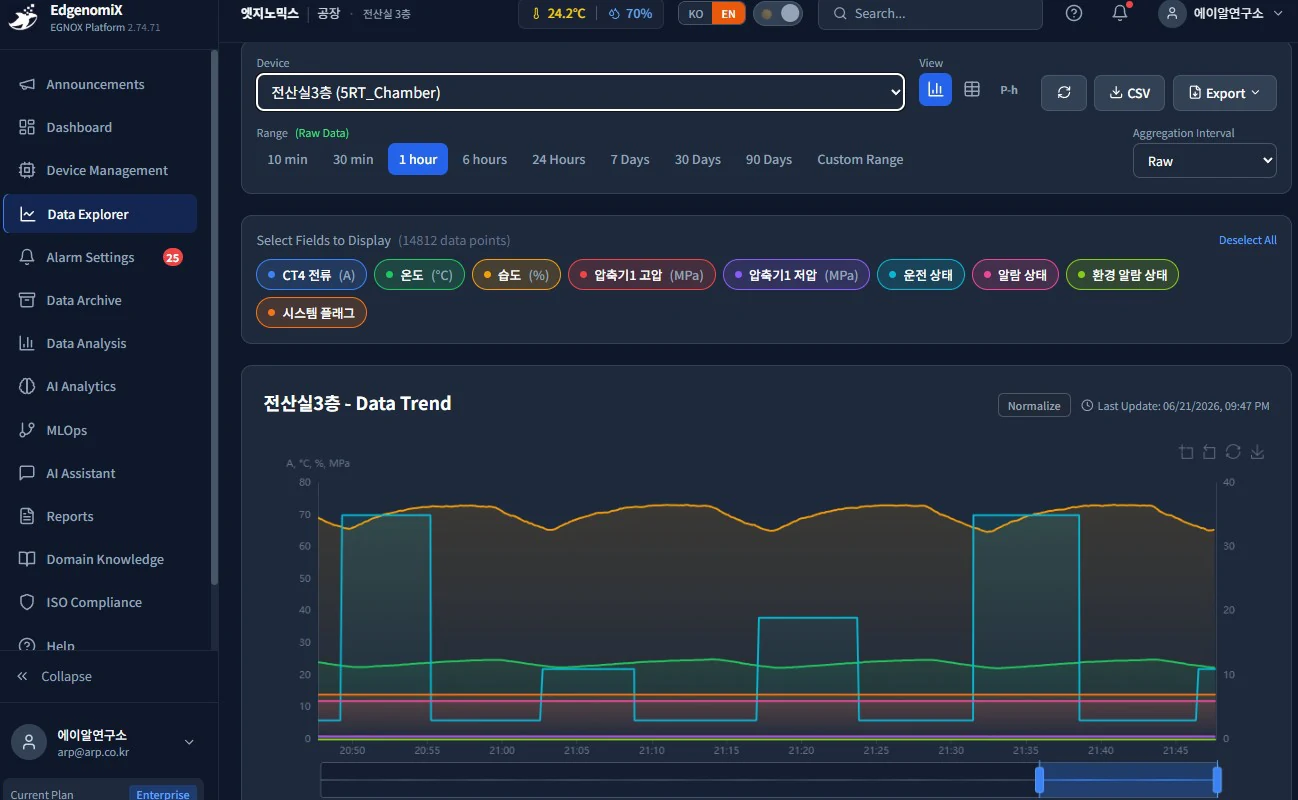
This is the actual operations screen of EGNOX Cloud. Displayed items may vary depending on the deployment environment.
Situations where teams start to consider adoption
Each site has a different screen, making a unified view difficult
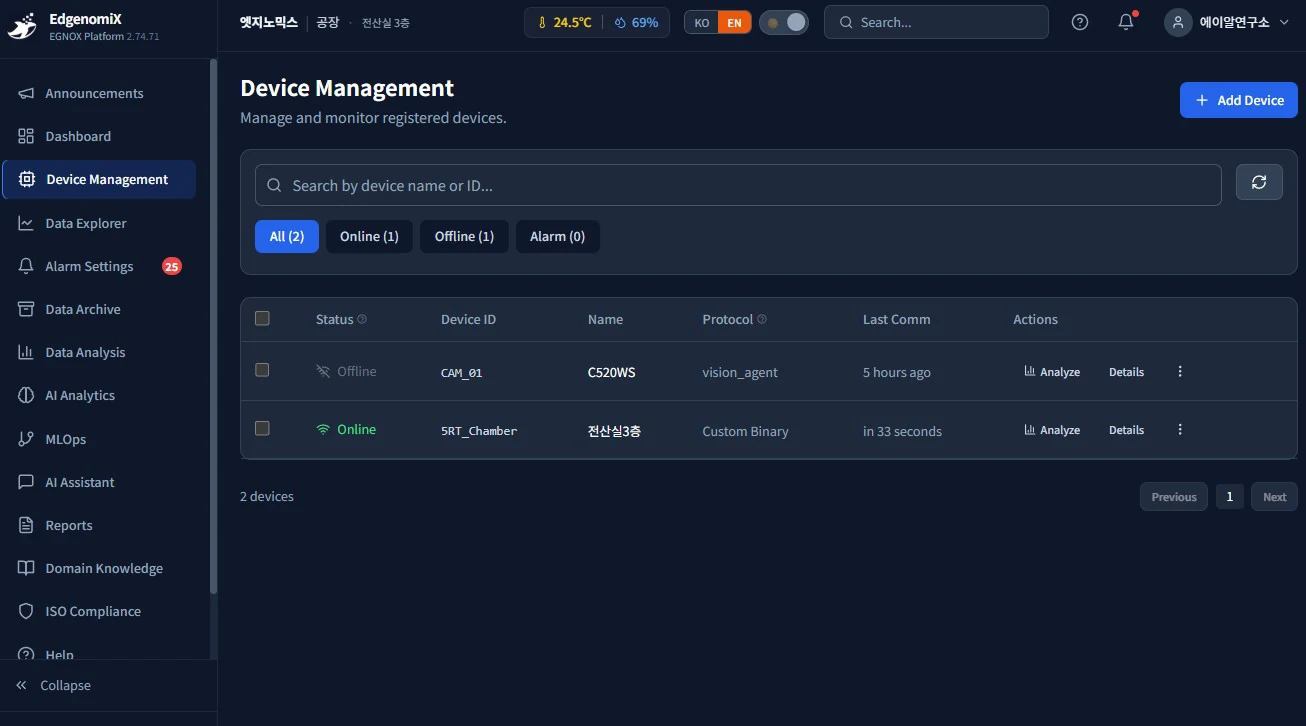
To see the status of multiple sites at a glance from headquarters, you must log in to each site's system separately. There is no unified control screen.
Connecting is cumbersome because each piece of equipment communicates differently
Protocols differ by manufacturer and model, so adding a new piece of equipment often requires development each time.
Finding the cause of an anomaly takes a long time
Alarms appear, but you have to dig through historical data yourself to understand why. It would help if AI could explain the cause right away.
Different communications per machine, connected on screen without code
Map the communication methods that differ by manufacturer and model through on-screen settings, with no coding. Assign a data type to each byte position in the frame, and incorrect mappings are validated in real time.
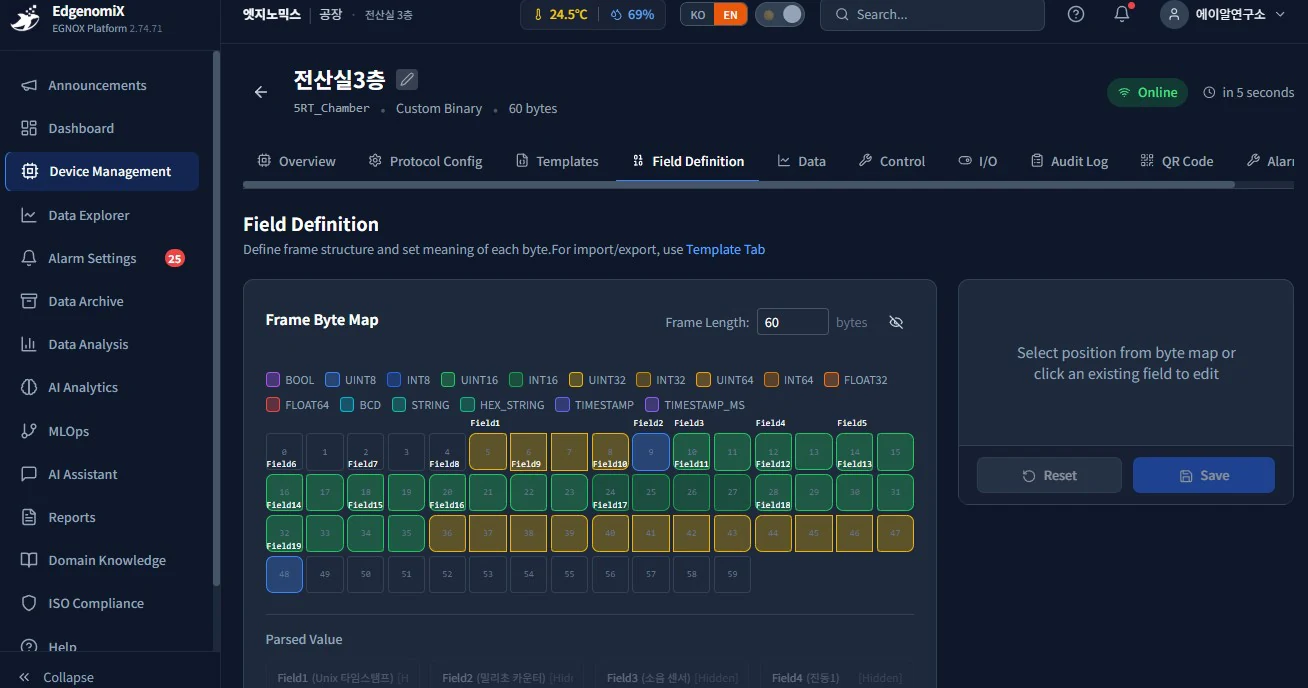
No-code protocol — define the meaning of each byte visually in the frame byte map.
Bundle a once-standardized protocol, AI baseline, labels, and alarm rules into a package, and apply the configuration to hundreds of identical units at once via export/import.
However many sites you have, view them all in a single browser
Statistics cards, gauges, real-time charts, an LED status board, image overlays on equipment photos, AI health, and RAG chat — arrange the widgets you need by drag-and-drop.
Drag-and-drop widgets
Operators, administrators, and customers each pick only the widgets they need to build their own screen. Freely arrange more than 20 kinds of widgets.
Image overlay
Place sensor values and status as pins on actual equipment photos or drawings, so it's clear at a glance which part is abnormal.
AI assistant panel
Ask questions in natural language without leaving the screen, and it explains causes and recommended actions together with the supporting data.
Physical indicators and AI diagnose together
Statistical health indicators provide reliability, while learning models and vision AI broaden the scope of diagnosis. It helps you catch early signs before a stoppage.
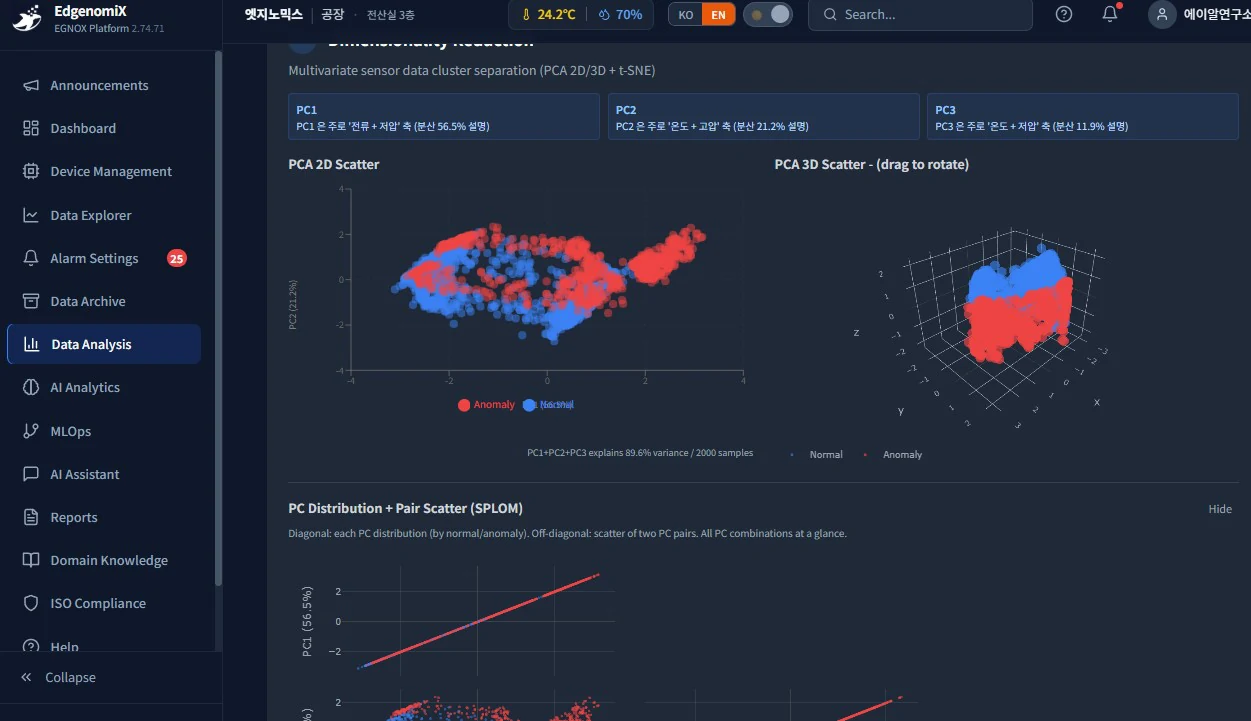
Multivariate health index
Combine multiple sensors into a single health score (Mahalanobis) to catch anomalies that would otherwise be hidden in individual averages.
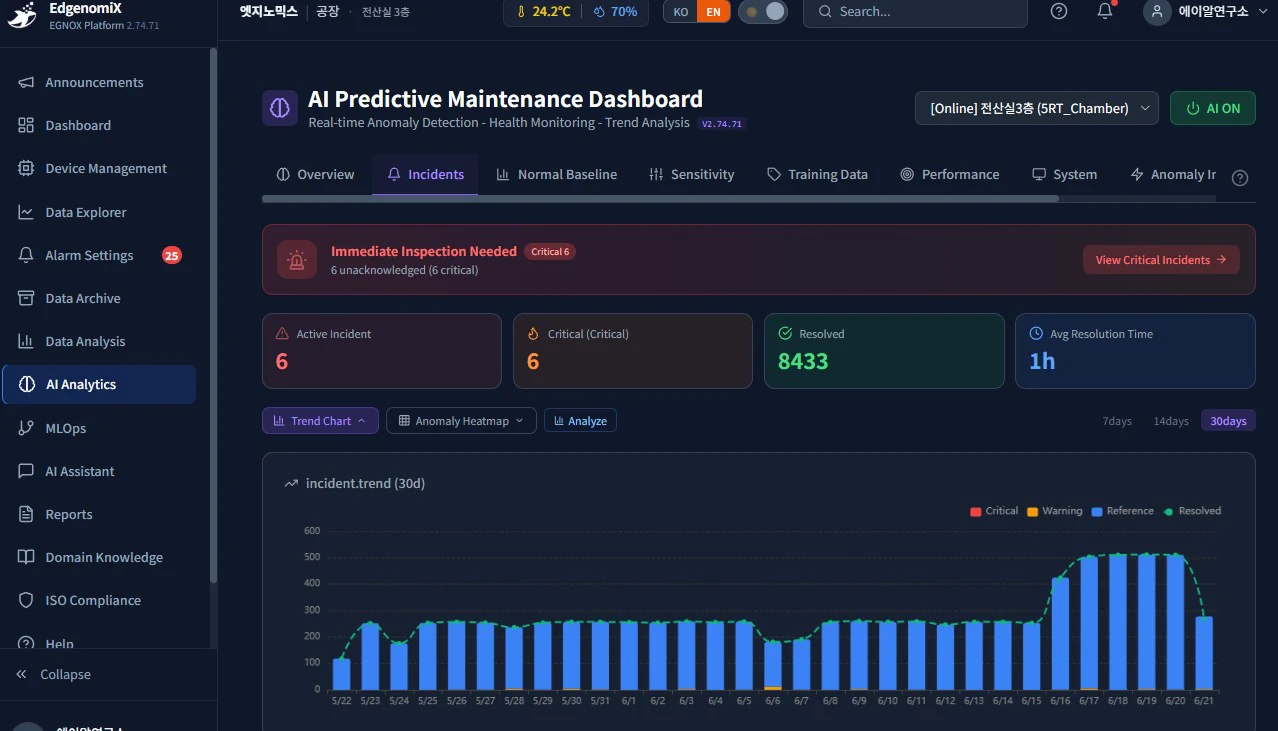
Real-time anomaly detection
Persistence-based judgment filters out momentary spikes and notifies only genuine anomalies.
Fault-type classification
Diagnose fault types such as filter clogging or low refrigerant as a multi-class problem.
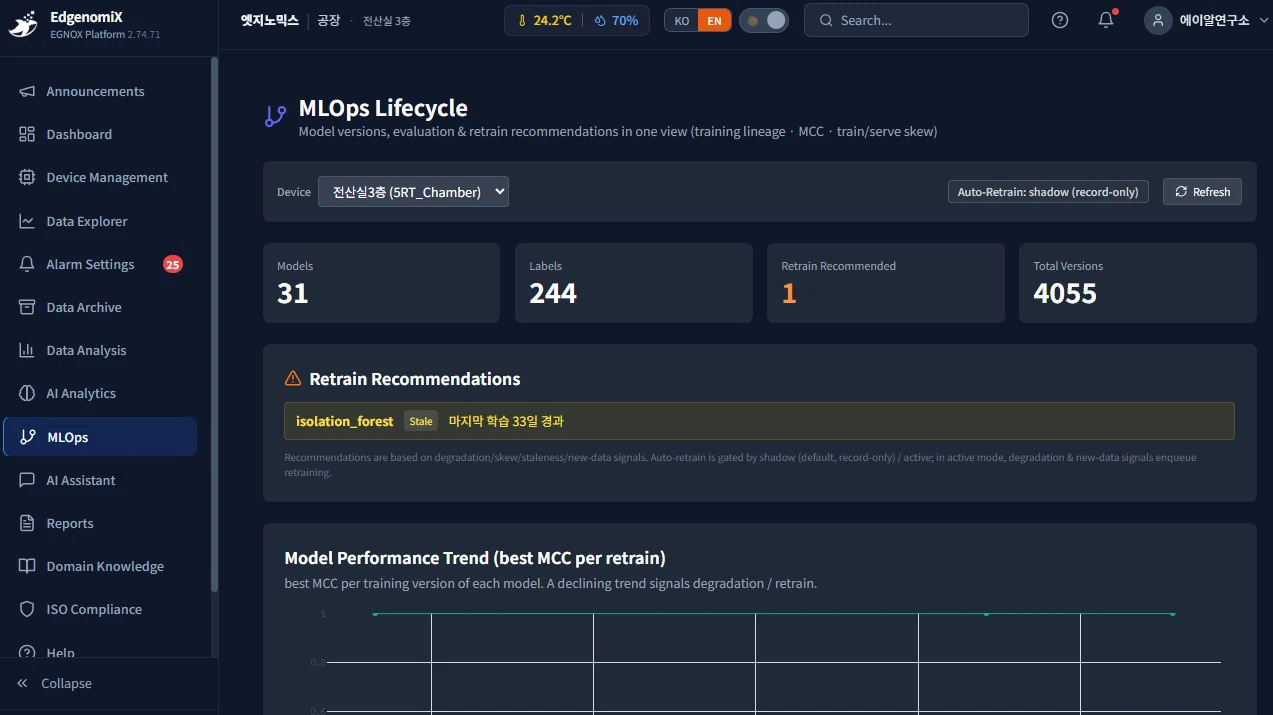
Trend forecasting · remaining useful life (RUL)
Extrapolate the health trend to estimate a recommended inspection time, down to the hour.
Vision AI second opinion
A vision model reads charts and images alongside you to assist human interpretation.
RAG equipment Q&A
Answers questions like "What is this alarm?" in natural language, grounded in manuals and history.
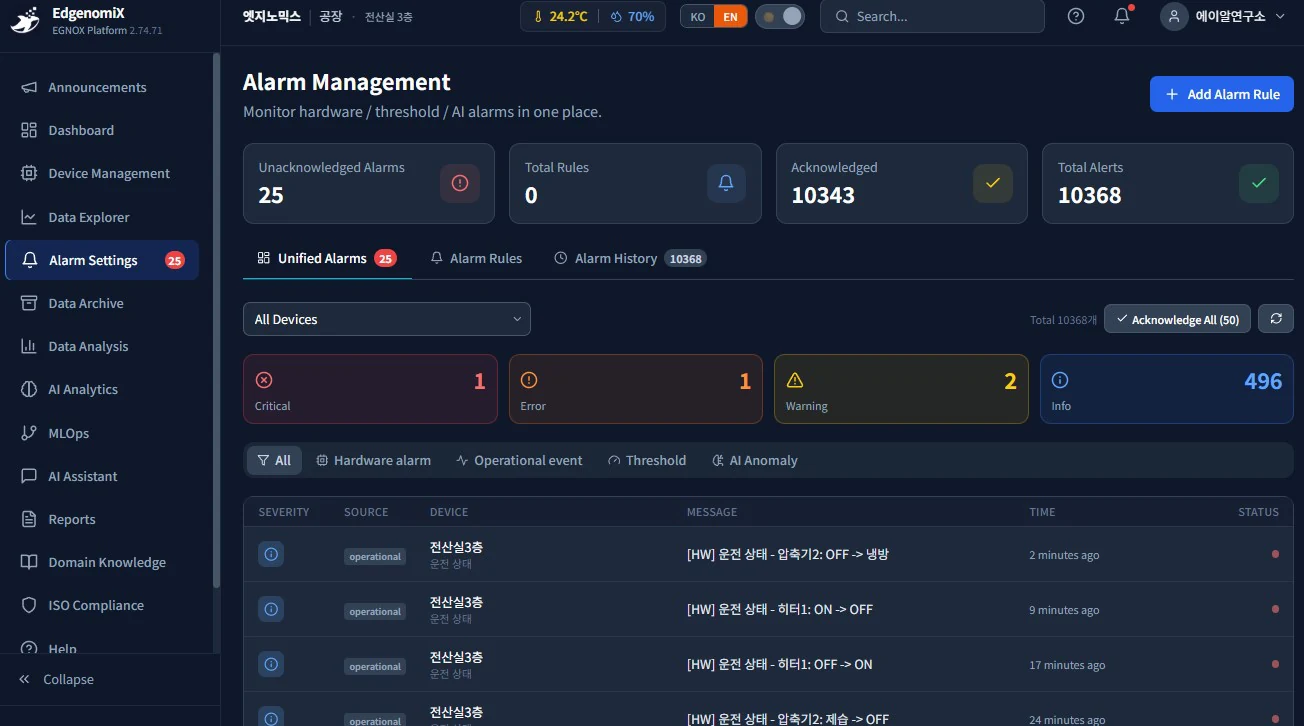
Not stopping at anomaly detection — through to repair completion
Connect anomaly detection → work order → parts → completion check in a closed loop to reduce maintenance gaps.
Work orders
Convert alarms into work orders and synchronize their status to reduce omissions.
Preventive-maintenance (PM) auto-scheduling
Automatically generate inspection tasks based on intervals and operating hours.
Parts inventory · reorder alerts
Deduct on consumption and flag when stock falls below the reorder point.
Contract-expiry alerts
Notify of maintenance-contract expiry in stages (60, 30, and 7 days ahead).
Inspection & history logs
Keep inspection and maintenance records to support internal rules and history management.
Customer acknowledgment (Ack)
When the customer confirms the outcome, it is shared in real time.
The screens you need for operations, on one platform
These are actual operations screens; displayed items and layout may vary depending on the deployment environment.
Anomaly detection and predictive maintenance using time-series sensor data
are also designed within a standards context
The cloud is not just a dashboard; it is a layer that connects data quality management, anomaly detection, condition assessment, RUL, and explanation logs to the operations screens.
- ISO 13374
- ISO 17359
- ISO 13381-1
- ISO/IEC 23053
- ISO/IEC 5259
- ISO/IEC TS 6254
- ISO/IEC TR 24029-1
Data coming up from sensors, PLCs, and edge devices is organized into a common tagging scheme and its data quality is checked.
Algorithm scores, baseline deviations, rates of change, and comparisons with similar history are shown together.
Remaining useful life estimates and inspection recommendations are linked to maintenance priorities.
Which data and evidence triggered a warning is recorded together in the operations screens and history.
Only what you need, scaling as you grow
Available in stages, from a small-device trial to large-scale and on-premises deployments. Detailed limits and pricing are provided during a consultation.
Trial · a few devices
- No-code connection trial
- Basic widget dashboard
- Real-time monitoring
Small-scale operations
- Everything in FREE, plus
- More devices
- Alarm & history analysis
Growth stage
- Everything in BASIC, plus
- AI predictive maintenance · Vision
- Maintenance closed-loop
Large-scale · custom
- Everything in PRO, plus
- Multi-tenancy · RLS isolation
- Edge · MLOps · on-premises
Where and how it is used
These usage scenarios are provided as a reference for adoption review. Actual configurations and figures may vary depending on the deployment environment.
Real-time unified control of equipment status across 5 plants from headquarters
Edge HMI data from each plant is collected into the Cloud. The headquarters control room monitors the status of all plants on a single screen. When an anomaly arises at a site, the responsible plant manager is automatically notified.
Review RUL by viewing equipment condition history and maintenance history together
Anomaly scores, load changes, and past maintenance history are viewed together in the Cloud. Responsible staff can adjust inspection priorities by referring to the remaining useful life range.
Immediate detection and reporting of temperature anomalies in cold storage
Temperature data from warehouses nationwide is monitored together in the Cloud. When values deviate from the baseline, the responsible staff and headquarters are notified at the same time. Monthly temperature history reports are generated automatically.
Technical specifications
| Connection protocols | Modbus (TCP/RTU/ASCII), OPC UA, Mitsubishi MC, LS XGT, Custom Binary/ASCII — no-code setup |
|---|---|
| Collection integration | EGNOX Edge HMI, IoT, Vision, and MQTT/REST API |
| Data retention | Retention period, aggregation interval, and storage policy are agreed based on plan and requirements |
| Access method | Browser-based SaaS / dedicated deployment discussed if needed |
| AI / analytics | Multivariate health index, anomaly detection, fault classification, RUL, Vision AI, and RAG equipment Q&A |
|---|---|
| Multi-tenancy | Separates manufacturers, customers, and individuals at the database level (RLS) |
| Edge · MLOps | Edge integration (e.g., Raspberry Pi) with automated training, evaluation, and deployment |
| Alert channels | Email, SMS, webhook, and Slack integration |
Products worth reviewing together
Which site data would you like to consolidate?
Tell us the number of sites, the types of data, and the scope of operations screens you need, and we will propose a suitable configuration.